Chapter 2 Data sources
2.1 VIX data
Cboe Global Markets, Inc. (Cboe) provides the daily VIX data (VIX_History.csv) in its website, https://www.cboe.com/tradable_products/vix/vix_historical_data/. It is created to reflect investors’ view of future expected stock market volatility, market’s “fear gauge.” Cboe Options Exchange makes the VIX index by S&P 500 index options. Options, ones of the financial derivatives, are the financial products which give buyers the right to buy or sell the underlying financial asset. Since the price of the options are adjusted by traders’ forecasts about the underlying asset, which is S&P 500 in the case of S&P 500 index options, it includes the information about volatility of their forecasts.
Though there are lots of data referred as “fear index,” such as the VXN index for NASDAQ, the VSTOXX index, the VDAX index, and the VSMI Volatility index for Europe, and the Asian VXJ index for Japan, we chose VIX because it is one of the most famous volatility indices.
VIX_History.csv has the following data of 8038 records from Jan. 2, 1990 to Nov. 30, 2021 at Dec. 1, 2021. We will analyze the VIX value in the Close column because the other data is made based on the values when the market is close.
Table 2.1: VIX data columns
| Column Name | Description |
|---|---|
| Date | The date of the VIX value (date) |
| Open | The VIX value when the market is open (num) |
| High | The highest VIX value on the date (num) |
| Low | The lowest VIX value on the date (num) |
| Close | The VIX value when the market is close (num) |
Issues with this dataset:
-The data format is clean and must be exactly calculated based on the accurate S&P 500 data because Cboe is the largest U.S. options exchange market. So, we do not have any problem about the data from this perspective.
-The VIX only has the information based on S&P 500. The limited traders in the world would check it. However, this is one of the points we want to analyze on this final project.
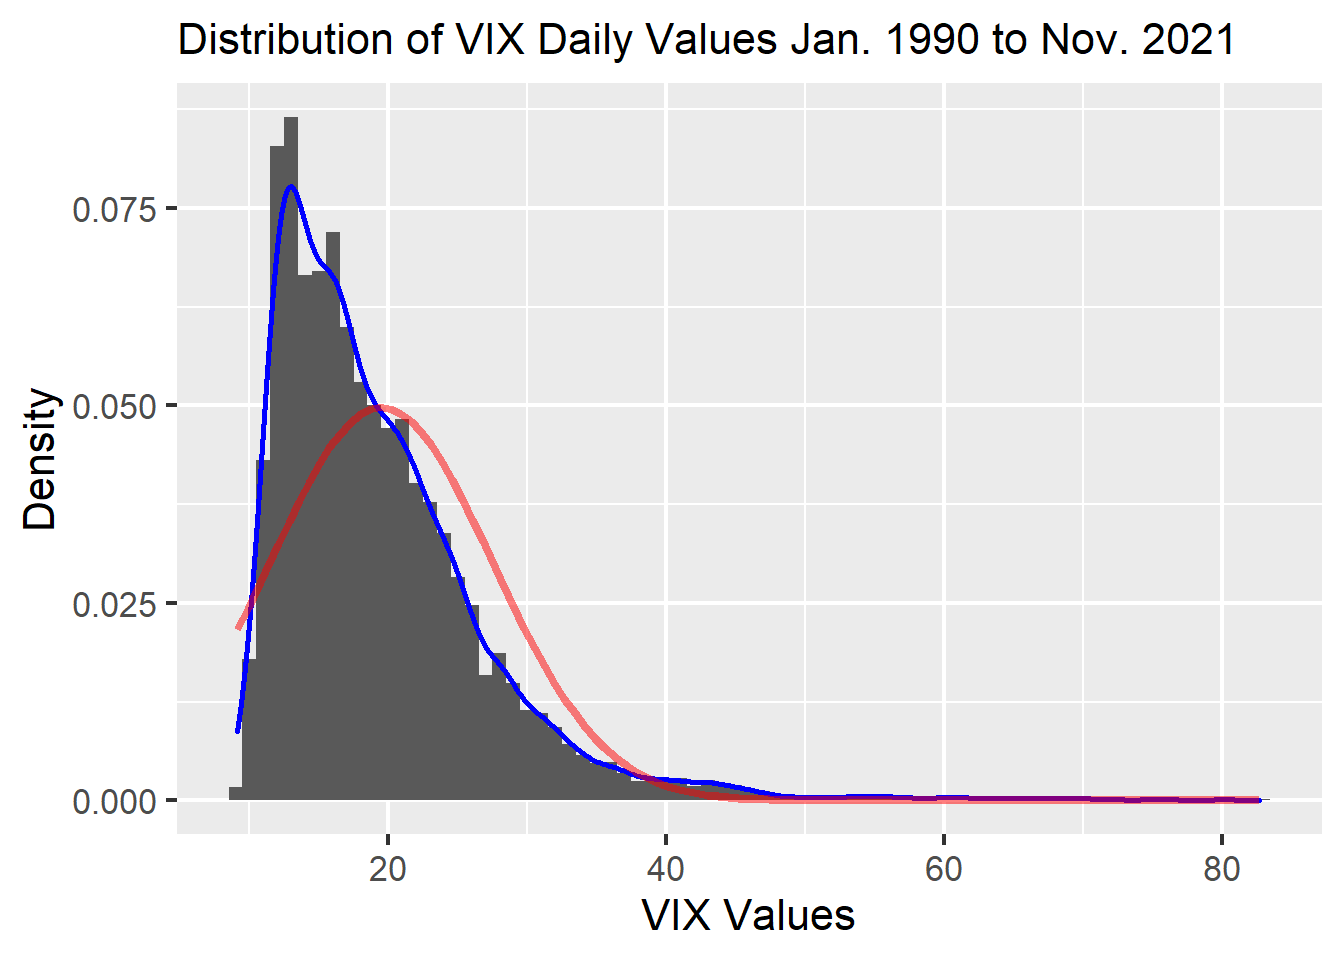
The distribution of the VIX Close value:
In the graph below, the blue curve is a density curve of the data and the red curve is the density curve of normal distribution with the same mean and the same standard deviation. We can see the data is far from normally distributed with a rather extreme right skew, suggesting traders regarded that the market is not in financial crisis in the most periods.
2.2 Stock indices data
we took the stock indices data from the website of Kenneth R. French, the Roth Family Distinguished Professor of Finance at the Tuck School of Business, Dartmouth College, prominent for Fama-French, https://mba.tuck.dartmouth.edu/pages/faculty/ken.french/data_library.html This is a well known dataset that has been used by many academics for asset pricing tests, not least the original Journal of Finance paper https://onlinelibrary.wiley.com/doi/10.1111/j.1540-6261.1992.tb04398.x
We selected this source because this provides a rich dataset of daily data on which we can calculate our returns, the data library includes returns on factors (which can be thought of as important risk characteristics (or covariance) of stock price movements) and various other portfolios such as sectors. Moreover, the other sites we checked provided the data only for the last 10 years, which do not include the period of the 2008 financial crisis.
We used the following six dataset (all return data are in percentages) from the website.
-5_Industry_Portfolios_Daily.csv
-F-F_Research_Data_5_Factors_2x3_daily.csv
-North_America_5_Factors_Daily.csv
-Europe_5_Factors_Daily.csv
-Asia_Pacific_ex_Japan_5_Factors_Daily.csv
-Japan_5_Factors_Daily.csv
5_Industry_Portfolios_Daily.csv has the following return data for five industries of 25105 records from Jul. 1, 1926 to Oct. 29, 2021 at Dec. 1, 2021. We will analyze the all column data in Table 2.2. The industry definitions are as described in Table 2.3.
Table 2.2: Industry return data columns
| Column Name | Description |
|---|---|
| (No Name) | The date of the return data (num) |
| Cnsmr | The return on closing prices of “Cnsmr” industry portfolio (num) |
| Manuf | The return on closing prices of “Manuf” industry portfolio (num) |
| HiTec | The return on closing prices of “HiTec” industry portfolio (num) |
| Hlth | The return on closing prices of “Hlth” industry portfolio (num) |
| Other | The return on closing prices of “Other” industry portfolio (num) |
Table 2.3: Industry definitions
| Industry Name | Compositions |
|---|---|
| Cnsmr | Consumer Durables, Nondurables, Wholesale, Retail, and Some Services Industries, including Laundries and Repair Shops |
| Manuf | Manufacturing, Energy, and Utilities Industries |
| HiTec | Business Equipment, Telephone and Television Transmission Industries |
| Hlth | Healthcare, Medical Equipment, and Drugs Industries |
| Other | Mines, Constr, BldMt, Trans, Hotels, Bus Serv, Entertainment, and Finance Industries |
The other five dataset all has the following return data for the market in each region. F-F_Research_Data_5_Factors_2x3_daily.csv has 14685 records for the US market from Jul. 1, 1963 to Oct. 29, 2021, and other four files have 8132 records for the markets in each region from Jul. 2, 1990 to Aug. 31, 2021, at Dec. 1, 2021. We will analyze the all column data in Table 2.2. We only employ Mkt-RF data of the five dataset other than date information. Other columns have the factor and risk free rate data for the fama french 5 factor models and other analysis much more specialized in finance.
Table 2.4: Other data columns
| Column Name | Description |
|---|---|
| (No Name) | The date of the return data (num) |
| Mkt-RF | The excess value-weight return on the market (num) |
| SMB | Small Minus Big factor, the average return on small portfolios minus that on big stock portfolios (num) |
| HML | High Minus Low factor, the average return on value portfolios minus the that on growth portfolios (num) |
| RMW | Robust Minus Weak, the average return on robust operating profitability portfolios minus that on weak operating profitability portfolios (num) |
| CMA | Conservative Minus Aggressive, the average return on conservative investment portfolios minus that on aggressive investment portfolios (num) |
| RF | The risk free rate, the minimum return an investor expects for any investment without any risks (num) |
Issues with this dataset:
-The data format is a bit different from other dataset, so we need to modify it, while it is clean and must be exactly calculated because the dataset is quite well known.
-Although we chose this dataset for the analysis for the period more than ten years, the other dataset would help us find more intriguing findings because the data on this website is more or less limited.